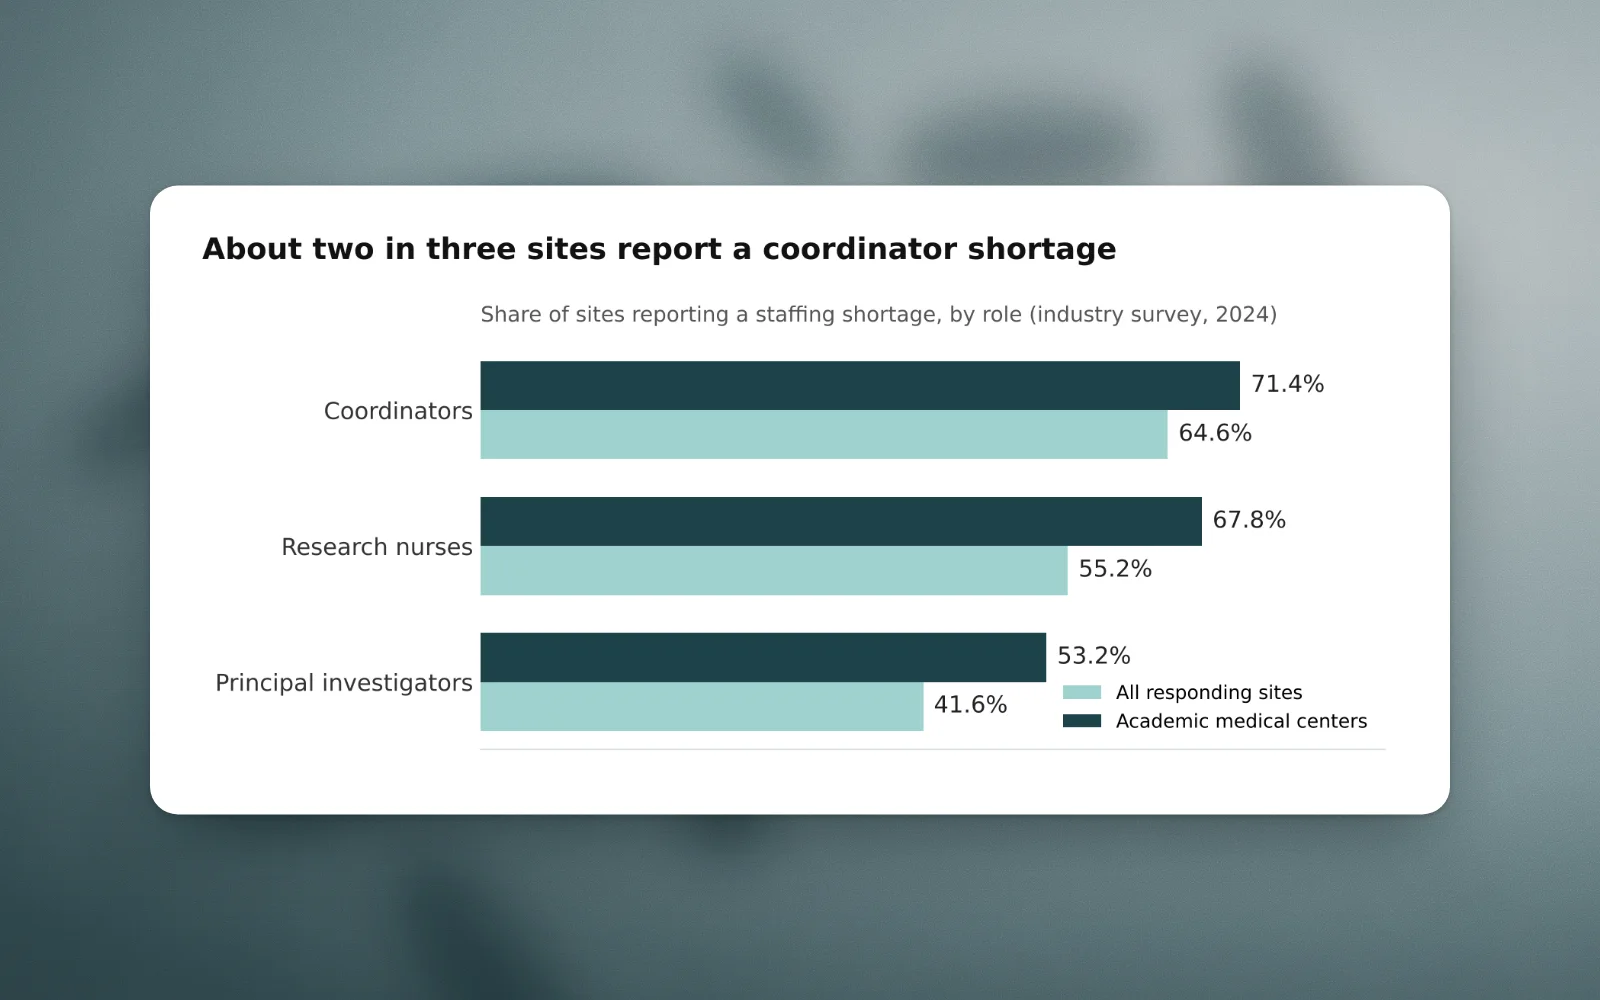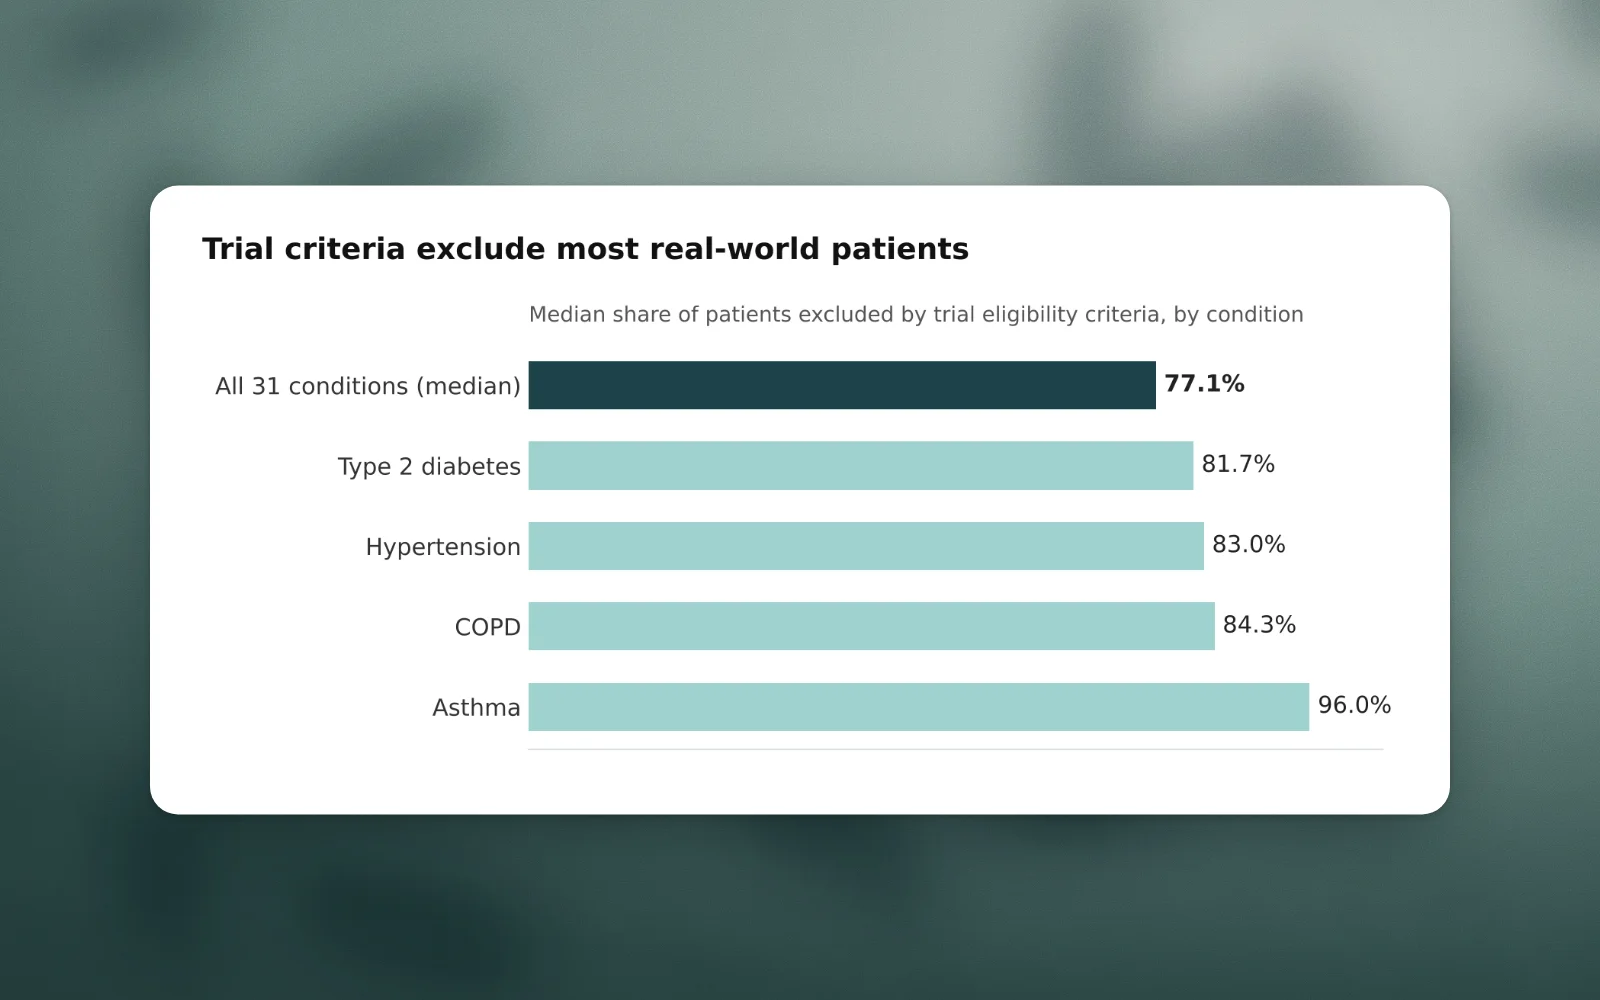

A site’s decision to accept or decline a study is made under uncertainty about three things: how many eligible patients the site actually has, whether the budget will cover the work, and how heavy the protocol will be to run. The evidence reviewed here suggests that each of these is hard to judge in advance, and that sites carry much of the cost when the judgment is wrong. In a Tufts CSDD analysis of nearly 16,000 sites in 151 phase II and III trials, 11% of sites that were ready to recruit enrolled no patient at all, and 41% of activated sites fell short of their enrollment target (Getz, 2012).
This post reviews the site’s side of that decision, across disease areas. It argues that inaccurate feasibility estimates and the cost of manual screening sit at the center of the problem, and that a site with a dependable count of eligible patients is better placed to choose which studies to accept. A shorter final section covers a related gap: patients are seldom sent to an open trial at another institution.
Feasibility estimates are made early and rarely checked
Feasibility questionnaires ask a site to commit to an enrollment number before the protocol is final and before a budget exists. Kenneth Getz of Tufts CSDD observed in 2008 that eligibility criteria make patient availability hard to estimate, that sites often lack the time or compensation to validate their projections, and that sponsors rarely check them. Sponsors report discounting site figures, and in their accounts even the adjusted figures were accurate less than 10% of the time, though Getz presented this as anecdotal rather than measured (Getz, 2008). The same article notes that sites believe a favorable projection makes them more attractive to sponsors, which gives them a reason to err upward.
The one formal test we found points the same way. A 2017 study used questionnaire answers and 59 candidate predictors to forecast which centers would meet their targets in phase III trials, and the best model was only a marginal improvement over a model with no predictors (van den Bor et al., 2017). An October 2026 Clinical Leader report on a webinar panel of sponsor feasibility leads made a related point: one panelist said that “historical data is not evidence of future enrollment” (Clinical Leader, 2026).
The picture is not uniformly bleak. A 2024 Tufts CSDD benchmark comparing 2012, 2019 and 2023 found that actual enrollment exceeded planned enrollment for a majority of studies (Lamberti et al.). That finding concerns study-level totals, whereas the decision a site faces is about its own count, and the 2012 figures above show that individual sites still miss in large numbers. The practical difficulty is that a coordinator answering a questionnaire usually has no systematic way to count eligible patients, and a quick answer may be requested in as little as 24 to 48 hours (SCRS, 2023, industry commentary by Aspen Insights published on the SCRS website).
Manual screening makes the count expensive
Counting eligible patients accurately means reviewing charts against every criterion. In a survey of 693 providers, mostly physicians and nurses, only 49.2% screened all patients for onsite trials, and screening was typically done by manual chart review (81.9%) (Durden et al., 2024). Getz also noted that sponsors often do not pay sites for the work of validating their projections (Getz, 2008). A site must therefore choose between spending unpaid hours on a careful count and giving an estimate it cannot defend.
Budgets often leave site work unpaid
Once a site is interested, the budget and contract must be agreed. In an Advarra survey conducted in late 2020, academic medical centers most commonly reported budget negotiations of more than 90 days, and other sites most commonly reported 30 to 90 days (Advarra, 2021). In the Durden survey, contracting and paperwork were the greatest barrier to opening more onsite trials (48.5%) (Durden et al., 2024). The Clinical Trials Transformation Initiative likewise describes budgets and contracts as significant contributors to delay in study start-up (CTTI, 2025).
The SCRS Site Landscape Survey for 2023 reports that 38% of sites saw profit decline that year and that 88% say screen failures are not sufficiently covered by payments. It also lists start-up costs, training, recruitment and prescreening among the most underfunded items (SCRS, 2024). Prescreening and screen failures matter most for a site that overestimated its patient pool: every extra chart reviewed to find an eligible patient is work that the per-patient payment does not reimburse. The SCRS document did not report its sample size in the text we could read, so these percentages are best treated as indicative.
Protocols require more of each site than they did a decade ago
The third pressure comes from the protocol itself. Tufts CSDD analyzed 187 phase I to III protocols approved between 2013 and 2018. In the paper’s trend data for phase II and III protocols, total procedures performed rose 67.3%, from 159.7 per protocol in 2009 to 2012 to 267.1 in 2017 to 2020; over the same periods endpoints rose 27.1% and eligibility criteria rose 10.1%, from 29.7 to 32.7 (Getz et al., 2023). Rare disease protocols averaged 301.6 procedures against 255.6 for other protocols, and oncology protocols carried even more (post 6 gives those figures), so the burden is heaviest in those fields but present throughout. Mean time from protocol approval to first patient first visit was 165.6 days in phase III and 173.3 days in rare disease.
Amendments add to the load after a site has started. Reporting on a Tufts CSDD analysis, CenterWatch (a trade publication, cited here as secondary) gave the average number of substantial amendments per phase III protocol as 3.3 for 2018 to 2020, up from 2.3 for 2013 to 2015 (CenterWatch, 2022). We did not find a source we could open that quantifies how much complexity lowers enrollment at a given site, so this section establishes rising burden rather than a measured loss of patients.
What this means for a site deciding whether to participate
Taken together, these findings describe a decision made with weak inputs. The site’s enrollment projection is a guess, the budget may not cover prescreening, and the protocol demands more procedures and criteria each year. Sites that accept a study they cannot enroll absorb the loss, a concern raised in the SCRS commentary above. We know of no study showing that a validated patient count improves a site’s study selection, so that step is our inference. Our reasoning is that a feasibility answer built from a systematic review of the site’s own records can be checked and defended, whereas one built from memory cannot.
The referral gap between sites
A site that declines a study, or whose patients do not fit its portfolio, could in principle send those patients to a trial elsewhere. The evidence suggests this happens unevenly. The Durden survey concluded that offsite referrals were rare (Durden et al., 2024), and in a survey of 372 neuro-oncology providers only 22% reported that their center tracks referrals inside and outside the institution; the most common barrier was finding ongoing trials in the patient’s area (Rogers et al., 2020). A 2022 survey of 58 community cancer centers found that 79% (46) referred patients to outside centers, mostly in late-stage or progressing disease, yet only 37% of those (17) had a protocol for follow-up after the referral (Ebrahimi et al., 2024). Referral therefore occurs, but late and without much tracking. These studies are all in oncology, and we did not find comparable cross-institution data for other disease areas.
Where Centrova fits
Centrova’s platform reviews the clinical notes and documents a site already holds and checks each patient against the inclusion and exclusion criteria of open trials. Coordinators and investigators review the candidates and make the final eligibility determination. The platform also includes patient tracking, communication and site coordination tools, and works across disease areas and multiple EHR systems. Testing is free during development: contact us.
Sources
- Getz K. Enrollment performance: weighing the “facts.” Applied Clinical Trials. 2012;21(5). May 1, 2012. https://www.appliedclinicaltrialsonline.com/view/enrollment-performance-weighing-facts
- Getz K. Is investigative site feasibility feasible? Applied Clinical Trials. July 1, 2008. https://www.appliedclinicaltrialsonline.com/view/investigative-site-feasibility-feasible
- van den Bor RM, Grobbee DE, Oosterman BJ, Vaessen PWJ, Roes KCB. Predicting enrollment performance of investigational centers in phase III multi-center clinical trials. Contemp Clin Trials Commun. 2017;7:208-216. https://doi.org/10.1016/j.conctc.2017.07.004
- Schell D. Can we make feasibility more realistic? Clinical Leader. October 8, 2026. https://www.clinicalleader.com/doc/can-we-make-feasibility-more-realistic-0001
- Lamberti MJ, Dirks A, Kikuchi N, Patel Cervantes N, Getz K. Benchmarking site activation and patient enrollment. Ther Innov Regul Sci. 2024;58(4):696-703. https://doi.org/10.1007/s43441-024-00638-1
- Aspen Insights. Is everyone just guessing on their feasibility analysis? Society for Clinical Research Sites (website article; industry commentary). June 1, 2023. https://myscrs.org/resources/is-everyone-just-guessing-on-their-feasibility-analysis/
- Durden K, Hurley P, Butler DL, Farner A, Shriver SP, Fleury ME. Provider motivations and barriers to cancer clinical trial screening, referral, and operations: findings from a survey. Cancer. 2024;130(1):68-76. https://doi.org/10.1002/cncr.35044
- Advarra. Study activation survey results: budget negotiation. April 16, 2021. https://www.advarra.com/blog/study-activation-budget-negotiation/
- Clinical Trials Transformation Initiative. CTTI report finds contracting and budgeting are significant pain points for study start-up (web page; last modified March 5, 2025). https://ctti-clinicaltrials.org/?p=5054
- Society for Clinical Research Sites. Site Finances Whitepaper (2023 Site Landscape Survey). 2024. https://myscrs.org/wp-content/uploads/2024/08/Site-Finances-Whitepaper-2024.pdf
- Getz K, Smith Z, Kravet M. Protocol design and performance benchmarks by phase and by oncology and rare disease subgroups. Ther Innov Regul Sci. 2023;57(1):49-56. https://doi.org/10.1007/s43441-022-00438-5
- CenterWatch. No end in sight for trial complexity, CSDD report reveals. January 17, 2022. https://centerwatch.com/articles/25921-no-end-in-sight-for-trial-complexity-csdd-report-reveals
- Rogers JL, Acquaye A, Vera E, Bates A, Wen PY, Armstrong TS. Provider-reported challenges and barriers to referring patients to neuro-oncology clinical trials: a report from the Society for Neuro-Oncology member survey. Neurooncol Pract. 2020;7(1):38-51. https://doi.org/10.1093/nop/npz038
- Ebrahimi H, Megally S, Plotkin E, et al. Barriers to clinical trial implementation among community care centers. JAMA Netw Open. 2024;7(4):e248739. https://doi.org/10.1001/jamanetworkopen.2024.8739